Permutations
Permutations
Figuring out how to arrange things is pretty important.
Like, if we have the letters {A,B,C}, the six ways to arrange them are: ABC ACB BAC BCA CAB CBA
And we can say more interesting things about them (e.g. Combinatorics) another great extension is when we get dynamic
Like, if we go from ABC to ACB, and back…

We can abstract away from needing to use individual letters, and say these are both “switching the 2nd and 3rd elements,” and it is the same thing both times.
Each of these switches can be more complicated than that, like going from ABCDE to EDACB is really just 1->3->4->2->5->1, and we can do it 5 times and cycle back to the start

We can also have two switches happening at once, like 1->2->3->1 and 4->5->4, and this cycles through 6 times to get to the start.

Then, let’s extend this a bit further.
First, let’s first get a better notation, and use (1 2 3) for what I called 1->2->3->1 before.
Let’s show how we can turn these permutations into a group.
Then, let’s say the identity is just keeping things the same, and call it id.
And, this repeating thing can be extended into making the group combiner: doing one permutation and then the other. For various historical reasons, the combination of permutation A and then permutation B is B·A.
This is closed, because permuting all the things and then permuting them again still keeps 1 of all the elements in an order.
Inverses exist, because you just need to put everything from the new position into the old position to reverse it.
Associativity will be left as an exercise to the reader (read: I don’t want to prove it)
More Posts from Jupyterjones and Others
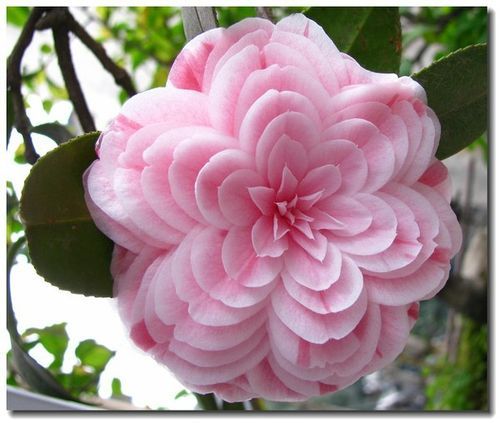

Speaking of pretty flowers, may I present to you the “Eighteen Scholars”, the flower of my heart-a variation of Camellia japonica L. Its uniqueness lies in the layers and layers of petals-one flower can hold as much as 130 petals.
Named “Eighteen Scholars” in Chinese because at the most, one bush can have up to eighteen of these pretty darlings :3

This shows that the probability of a random variable is maximum at the average and diminishes as one goes away from it, eventually leading to a bell-curve.


What’s encrypting your internet surfing? An algorithm created by a supercomputer? Well, if the site you’re visiting is encrypted by the cyber security firm Cloudflare, your activity may be protected by a wall of lava lamps.

Cloudflare covers websites for Uber, OKCupid, & FitBit, for instance. The wall of lamps in the San Francisco headquarters generates a random code. Over 100 lamps, in a variety of colors, and their patterns deter hackers from accessing data.

As the lava lamps bubble and swirl, a video camera on the ceiling monitors their unpredictable changes and connects the footage to a computer, which converts the randomness into a virtually unhackable code.
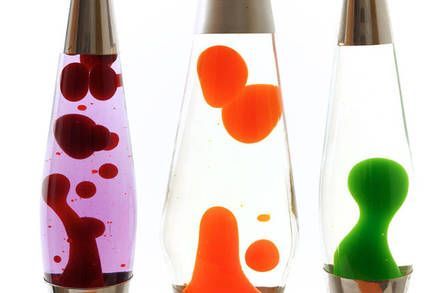
Codes created by machines have relatively predictable patterns, so it’s possible for hackers to guess their algorithms, posing a security risk. Lava lamps, add to the equation the sheer randomness of the physical world, making it nearly impossible for hackers to break through.

You might think that this would be kept secret, but it’s not. Simply go in and ask to see the lava lamp display. By allowing people to affect the video footage, human movement, static, and changes in lighting from the windows work together to make the random code even harder to predict.

So, by standing in front of the display, you add an additional variable to the code, making it even harder to hack. Isn’t that interesting?
via atlasobscura.com


Regarding Fractals and Non-Integral Dimensionality
Alright, I know it’s past midnight (at least it is where I am), but let’s talk about fractal geometry.
Fractals
If you don’t know what fractals are, they’re essentially just any shape that gets rougher (or has more detail) as you zoom in, rather than getting smoother. Non-fractals include easy geometric shapes like squares, circles, and triangles, while fractals include more complex or natural shapes like the coast of Great Britain, Sierpinski’s Triangle, or a Koch Snowflake.

Fractals, in turn, can be broken down further. Some fractals are the product of an iterative process and repeat smaller versions of themselves throughout them. Others are more natural and just happen to be more jagged.

Fractals and Non-Integral Dimensionality
Now that we’ve gotten the actual explanation of what fractals are out of the way, let’s talk about their most interesting property: non-integral dimensionality. The idea that fractals do not actually have an integral dimension was originally thought up by this guy, Benoit Mandelbrot.

He studied fractals a lot, even finding one of his own: the Mandelbrot Set. The important thing about this guy is that he realized that fractals are interesting when it comes to defining their dimension. Most regular shapes can have their dimension found easily: lines with their finite length but no width or height; squares with their finite length and width but no height; and cubes with their finite length, width, and height. Take note that each dimension has its own measure. The deal with many fractals is that they can’t be measured very easily at all using these terms. Take Sierpinski’s triangle as an example.

Is this shape one- or two-dimensional? Many would say two-dimensional from first glance, but the same shape can be created using a line rather than a triangle.

So now it seems a bit more tricky. Is it one-dimensional since it can be made out of a line, or is it two-dimensional since it can be made out of a triangle? The answer is neither. The problem is that, if we were to treat it like a two-dimensional object, the measure of its dimension (area) would be zero. This is because we’ve technically taken away all of its area by taking out smaller and smaller triangles in every available space. On the other hand, if we were to treat it like a one-dimensional object, the measure of its dimension (length) would be infinity. This is because the line keeps getting longer and longer to stretch around each and every hole, of which there are an infinite number. So now we run into a problem: if it’s neither one- nor two-dimensional, then what is its dimensionality? To find out, we can use non-fractals
Measuring Integral Dimensions and Applying to Fractals
Let’s start with a one-dimensional line. The measure for a one-dimensional object is length. If we were to scale the line down by one-half, what is the fraction of the new length compared to the original length?

The new length of each line is one-half the original length.
Now let’s try the same thing for squares. The measure for a two-dimensional object is area. If we were to scale down a square by one-half (that is to say, if we were to divide the square’s length in half and divide its width in half), what is the fraction of the new area compared to the original area?

The new area of each square is one-quarter the original area.
If we were to try the same with cubes, the volume of each new cube would be one-eighth the original volume of a cube. These fractions provide us with a pattern we can work with.
In one dimension, the new length (one-half) is equal to the scaling factor (one-half) put to the first power (given by it being one-dimensional).
In two dimensions, the new area (one-quarter) is equal to the scaling factor (one-half) put to the second power (given by it being two-dimensional).
In three dimensions, the same pattern follows suit, in which the new volume (one-eighth) is equivalent to the scaling factor (one-half) put to the third power.
We can infer from this trend that the dimension of an object could be (not is) defined as the exponent fixed to the scaling factor of an object that determines the new measure of the object. To put it in mathematical terms:

Examples of this equation would include the one-dimensional line, the two-dimensional square, and the three-dimensional cube:
½ = ½^1
¼ = ½^2
1/8 = ½^3
Now this equation can be used to define the dimensionality of a given fractal. Let’s try Sierpinski’s Triangle again.

Here we can see that the triangle as a whole is made from three smaller versions of itself, each of which is scaled down by half of the original (this is proven by each side of the smaller triangles being half the length of the side of the whole triangle). So now we can just plug in the numbers to our equation and leave the dimension slot blank.
1/3 = ½^D
To solve for D, we need to know what power ½ must be put to in order to get 1/3. To do this, we can use logarithms (quick note: in this case, we can replace ½ with 2 and 1/3 with 3).
log_2(3) = roughly 1.585
So we can conclude that Sierpinski’s triangle is 1.585-dimensional. Now we can repeat this process with many other fractals. For example, this Sierpinski-esque square:

It’s made up of eight smaller versions of itself, each of which is scaled down by one-third. Plugging this into the equation, we get
1/8 = 1/3^D
log_3(8) = roughly 1.893
So we can conclude that this square fractal is 1.893-dimensional.
We can do this on this cubic version of it, too:

This cube is made up of 20 smaller versions of itself, each of which is scaled down by 1/3.
1/20 = 1/3^D
log_3(20) = roughly 2.727
So we can conclude that this fractal is 2.727-dimensional.

The simple harmonic oscillator
Anonymous asked: Please explain the intuition of solving the SHM equation.
Okay Anon! Here you go, this is my rendition.
The problem
You have a mass suspended on a spring. We want to know where the mass will be at any instant of time.
Describe the motion of the mass

The physical solution
Now before we get on to the math, let us first visualize the motion by attaching a spray paint bottle as the mass.

Oh, wait that seems like a function that we are familiar with - The sinusoid.

Without even having to write down a single equation, we have found out the solution to our problem. The motion that is traced by the mass is a sinusoid.
But what do I mean by a sinusoid ?
If you took the plotted paper and tried to create that function with the help of sum of polynomials i.e x, x2, x3 … Now you this what it would like :

By taking an infinite of these polynomial sums you get the function Since this series of polynomial occurs a lot, its given the name - sine.

I hope this shed some light on the intuition of the SHM equation. Have fun!
How is geometry entangled in the fabric of the Universe?
Geometry can be seen in action in all scales of the Universe, be it astronomical – in the orbital resonance of the planets for example, be it at molecular levels, in how crystals take their perfect structures. But going deeper and deeper into the fabric of the material world, we find that at quantum scale, geometry is a catalyst for many of the laws of quantum-physics and even definitions of reality.
Take for example the research made by Duncan Haldane, John Michael Kosterlitz and David Thouless, the winners of the 2016 Nobel prize in physics. By using geometry and topology they understood how exotic forms of matter take shape based on the effects of the quantum mechanics. Using techniques borrowed from geometry and topology, they studied the changes between states of matter (from plasma to gas, from gas to liquid and from liquid to solid) being able to generate a set of rules that explain different types of properties and behaviors of matter. Furthermore, by coming across a new type of symmetry patterns in quantum states that can influence those behaviors or even create new exotic types of matter, they provided new meaning and chance in using geometry as a study of “the real”.
If the Nobel Prize winners used abstract features of geometry to define physical aspects of matter, more tangible properties of geometry can be used to define other less tangible aspects of reality, like time or causality. In relativity, 3d space and 1d time become a single 4d entity called “space-time”, a dimension perceived through the eye of a space-time traveler. When an infinite number of travelers are brought into the equation, the numbers are adding up fast and, to see how for example, a space-time of a traveler looks for another traveler, we can use geometric diagrams of these equations. By tracing what a traveler “sees” in the space-time dimension and assuming that we all see the same speed of light, the intersection points of view between a stationary traveler and a moving one give a hyperbola that represents specific locations of space-time events seen by both travelers, no matter of their reference frame. These intersections represent a single value for the space-time interval, proving that the space-time dimension is dependent of the geometry given by the causality hyperbola.
If the abstract influence of geometry on the dimensions of reality isn’t enough, take for example one of the most interesting experiments of quantum-physics, the double-split experiment, were wave and particle functions are simultaneously proven to be active in light or matter. When a stream of photons is sent through a slit against a wall, the main expectation is that each photon will strike the wall in a straight line. Instead, the photons are rearranged by a specific type of patterns, called diffraction patterns, a behavior mostly visible for small particles like electrons, neutrons, atoms and small molecules, because of their short wavelength.

Two slits diffraction pattern by a plane wave. Animation by Fu-Kwun Hwang
The wave-particle duality is a handful, since it is a theory that has worked well in physics but with its meaning or representation never been satisfactorily resolved. Perhaps future experiments that will involve more abstract roles of geometry in quantum fields, like in the case of the Nobel prize winners, will develop new answers to how everything functions at these small scales of matter.
In this direction, Garret Lissi tries to explain how everything works, especially at quantum levels, by uniting all the forces of the Universe, its fibers and particles, into a 8 dimensions geometric structure. He suggests that each dot, or reference, in space-time has a shape, called fibre, attributed to each type of particle. Thus, a separate layer of space is created, parallel to the one we can perceive, given by these shapes and their interactions. Although the theory received also good reviews but also a widespread skepticism, its attempt to describe all known fundamental aspects of physics into one possible theory of everything is laudable. And proving that with laws and theories of geometry is one step closer to a Universal Geometry theory.

Jupiter’s Great Red Spot
Jupiter’s Great Red Spot (GRS) is an atmospheric storm that has been raging in Jupiter’s southern Hemisphere for at least 400 years.
About 100 years ago, the storm covered over 40,000 km of the surface. It is currently about one half of that size and seems to be shrinking.
At the present rate that it is shrinking it could become circular by 2040. The GRS rotates counter-clockwise(anti-cyclonic) and makes a full rotation every six Earth days.
It is not known exactly what causes the Great Red Spot’s reddish color. The most popular theory, which is supported by laboratory experiments, holds that the color may be caused by complex organic molecules, red phosphorus, or other sulfur compounds.
The GRS is about two to three times larger than Earth. Winds at its oval edges can reach up to 425 mph (680 km/h)
Infrared data has indicated that the Great Red Spot is colder (and thus, higher in altitude) than most of the other clouds on the planet
Sources: http://www.universetoday.com/15163/jupiters-great-red-spot/ http://www.space.com/23708-jupiter-great-red-spot-longevity.html
-
 jonneycobalt liked this · 1 year ago
 -
 ateabeforedeath liked this · 4 years ago
 -
 andrejupiter liked this · 4 years ago
 -
 mad-phlegmatic reblogged this · 5 years ago
 -
mad-phlegmatic liked this · 5 years ago
-
 chopped-peace-collection liked this · 6 years ago
 -
 procrastinaciones liked this · 6 years ago
 -
 milo-icecream liked this · 6 years ago
 -
 mathematicalsvs-blog reblogged this · 6 years ago
 -
mathematicalsvs-blog liked this · 6 years ago
-
 allthingssquare liked this · 6 years ago
 -
 fays-unkle-blog liked this · 6 years ago
 -
 ricemackerel liked this · 7 years ago
 -
 birththatlast liked this · 7 years ago
 -
 hubbleheretic liked this · 7 years ago
 -
 gazorbzenius liked this · 7 years ago
 -
 angstroooms liked this · 7 years ago
 -
 pitselehs liked this · 7 years ago
 -
 elaboratelysimple liked this · 7 years ago
 -
 dustyweed liked this · 7 years ago
 -
 annieezombiee liked this · 7 years ago
 -
 chanaysavoyen liked this · 7 years ago
 -
 jupyterjones reblogged this · 7 years ago
 -
 crisdr-blog1 liked this · 7 years ago
 -
 uhhraw-uhh-jane liked this · 7 years ago
 -
 plantbandit liked this · 8 years ago
 -
 birdxy liked this · 8 years ago
 -
 fern-three liked this · 8 years ago
 -
 indi-vid-ua liked this · 8 years ago